Core product workflows
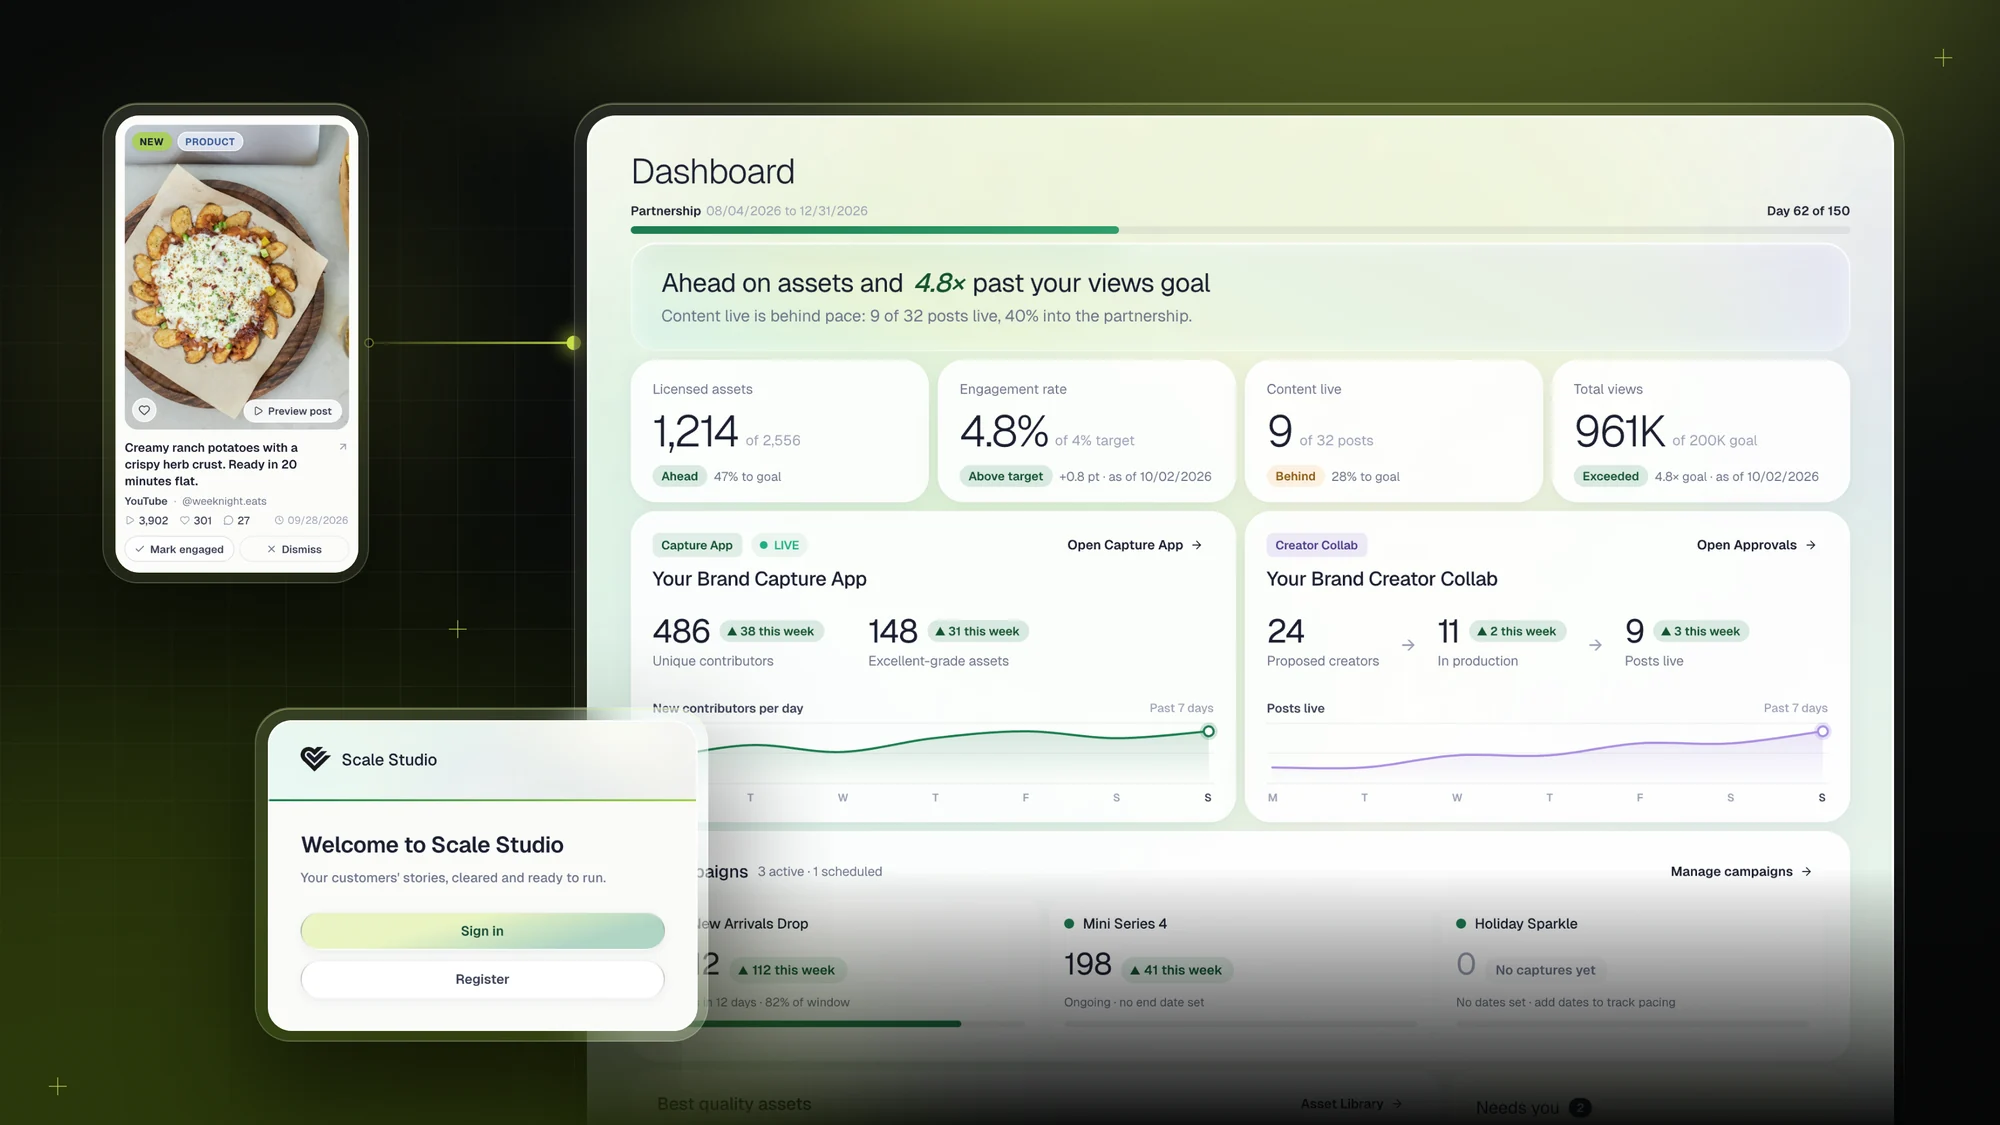
I lead end-to-end design for Scale Studio V2 across the Dashboard, Programs, and Asset Library, alongside capture-app settings, authentication, and admin workflows.

Product design · Design systems · Design-to-code
My work at Scale Social spans the product flows people use, the design system that connects them, and the details engineers need to build them.
I lead end-to-end design for Scale Studio V2 across the Dashboard, Programs, and Asset Library, alongside capture-app settings, authentication, and admin workflows.
I built Aurora around tokens, gradients, two-tier glass, and reusable components. My handoff combines detailed engineering specifications with design-to-code work using Pencil MCP and Claude Code.
I redesigned how content quality is communicated, replacing misleading charts with a segmented distribution bar. The aim: make the mix of content quality easier to interpret.
Communicating the product. I also create capture-app demos and walkthroughs for sales, with 25+ client demo mockups delivered between July and October 2026.
01 / Core product workflows
Scale Studio connects customer-created content with the brand teams who review, organize, and use it. I designed the workflows that turn that activity into a clear next step.
An early campaign card compared collected assets with a contract guarantee. But campaigns had no target field to supply that goal. I removed goal-pacing from the campaign card, kept actual counts and trends, and moved contract-level progress to the Dashboard.
This would preserve the same mismatch: a campaign is not a contract.
Campaigns show activity. The Dashboard shows progress toward partnership goals.
All submissions: the volume entering the platform.
Content that passed AI review: the measure tied to the contract goal.
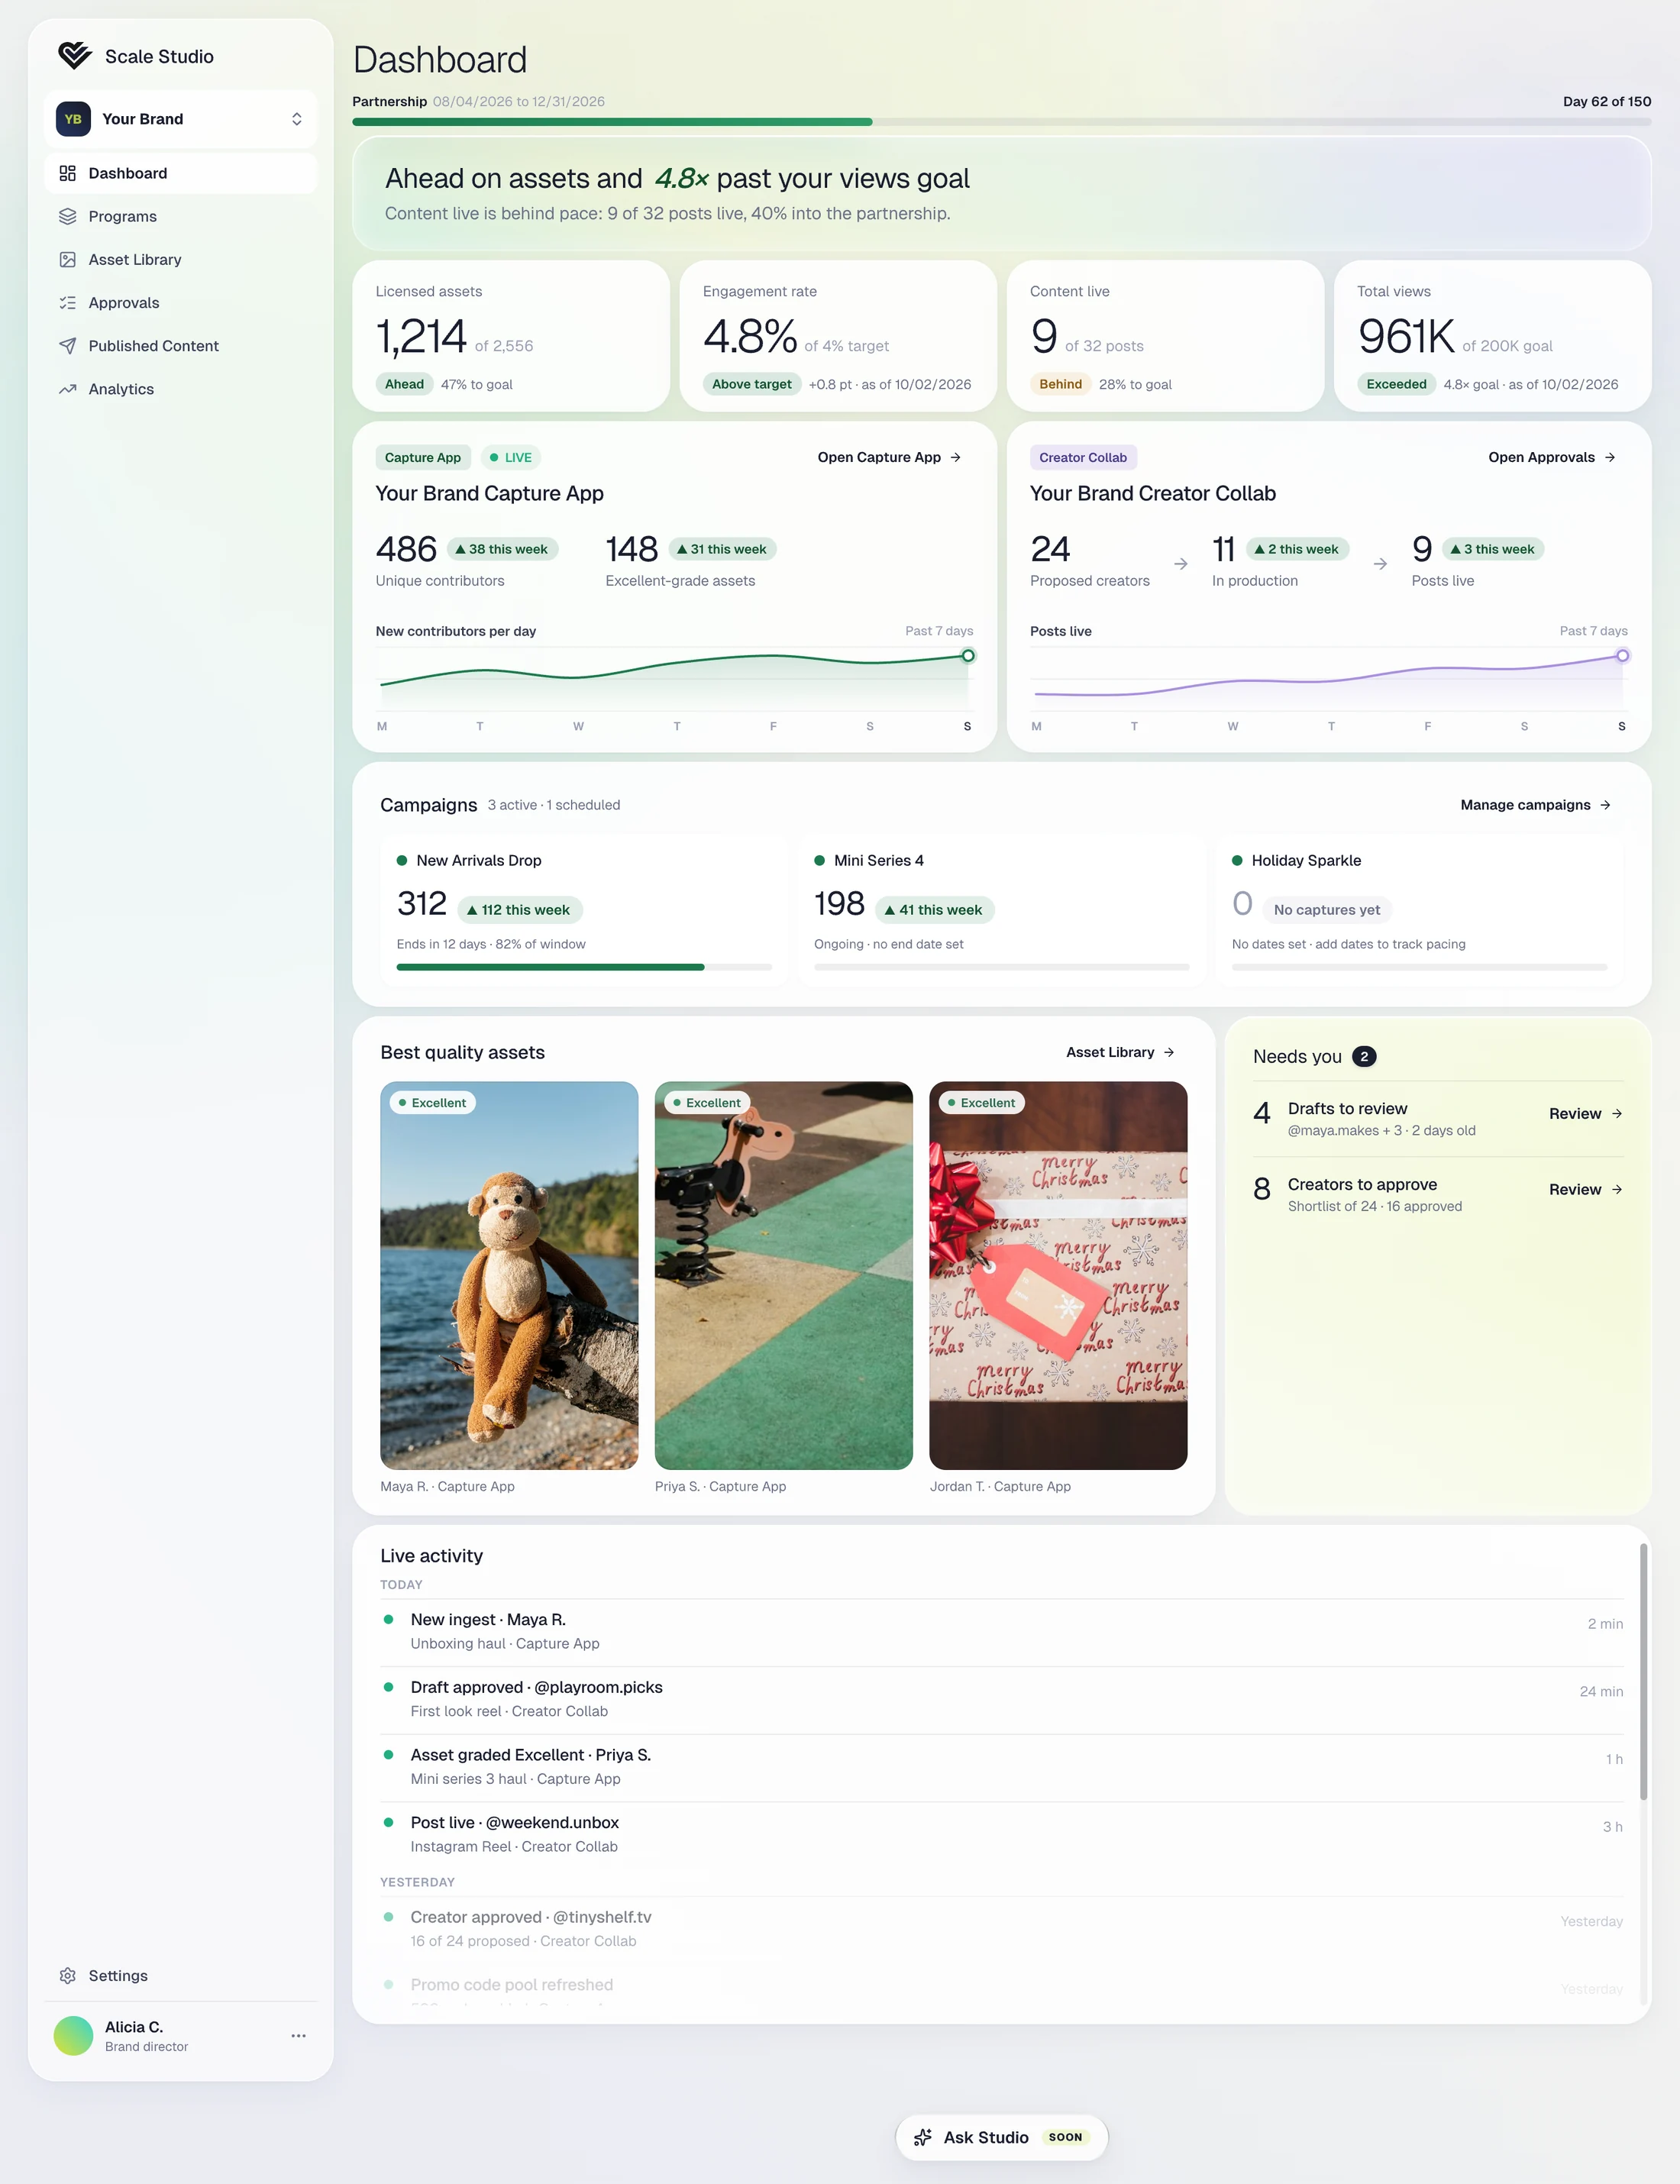
The same hierarchy adapts to active work, a cold start, missing goals, and a single program.
October 8 review: 34 comments worked through—30 solved in the design file, one resolved by the product partner, and three left open.
Asset Library / Interaction detail
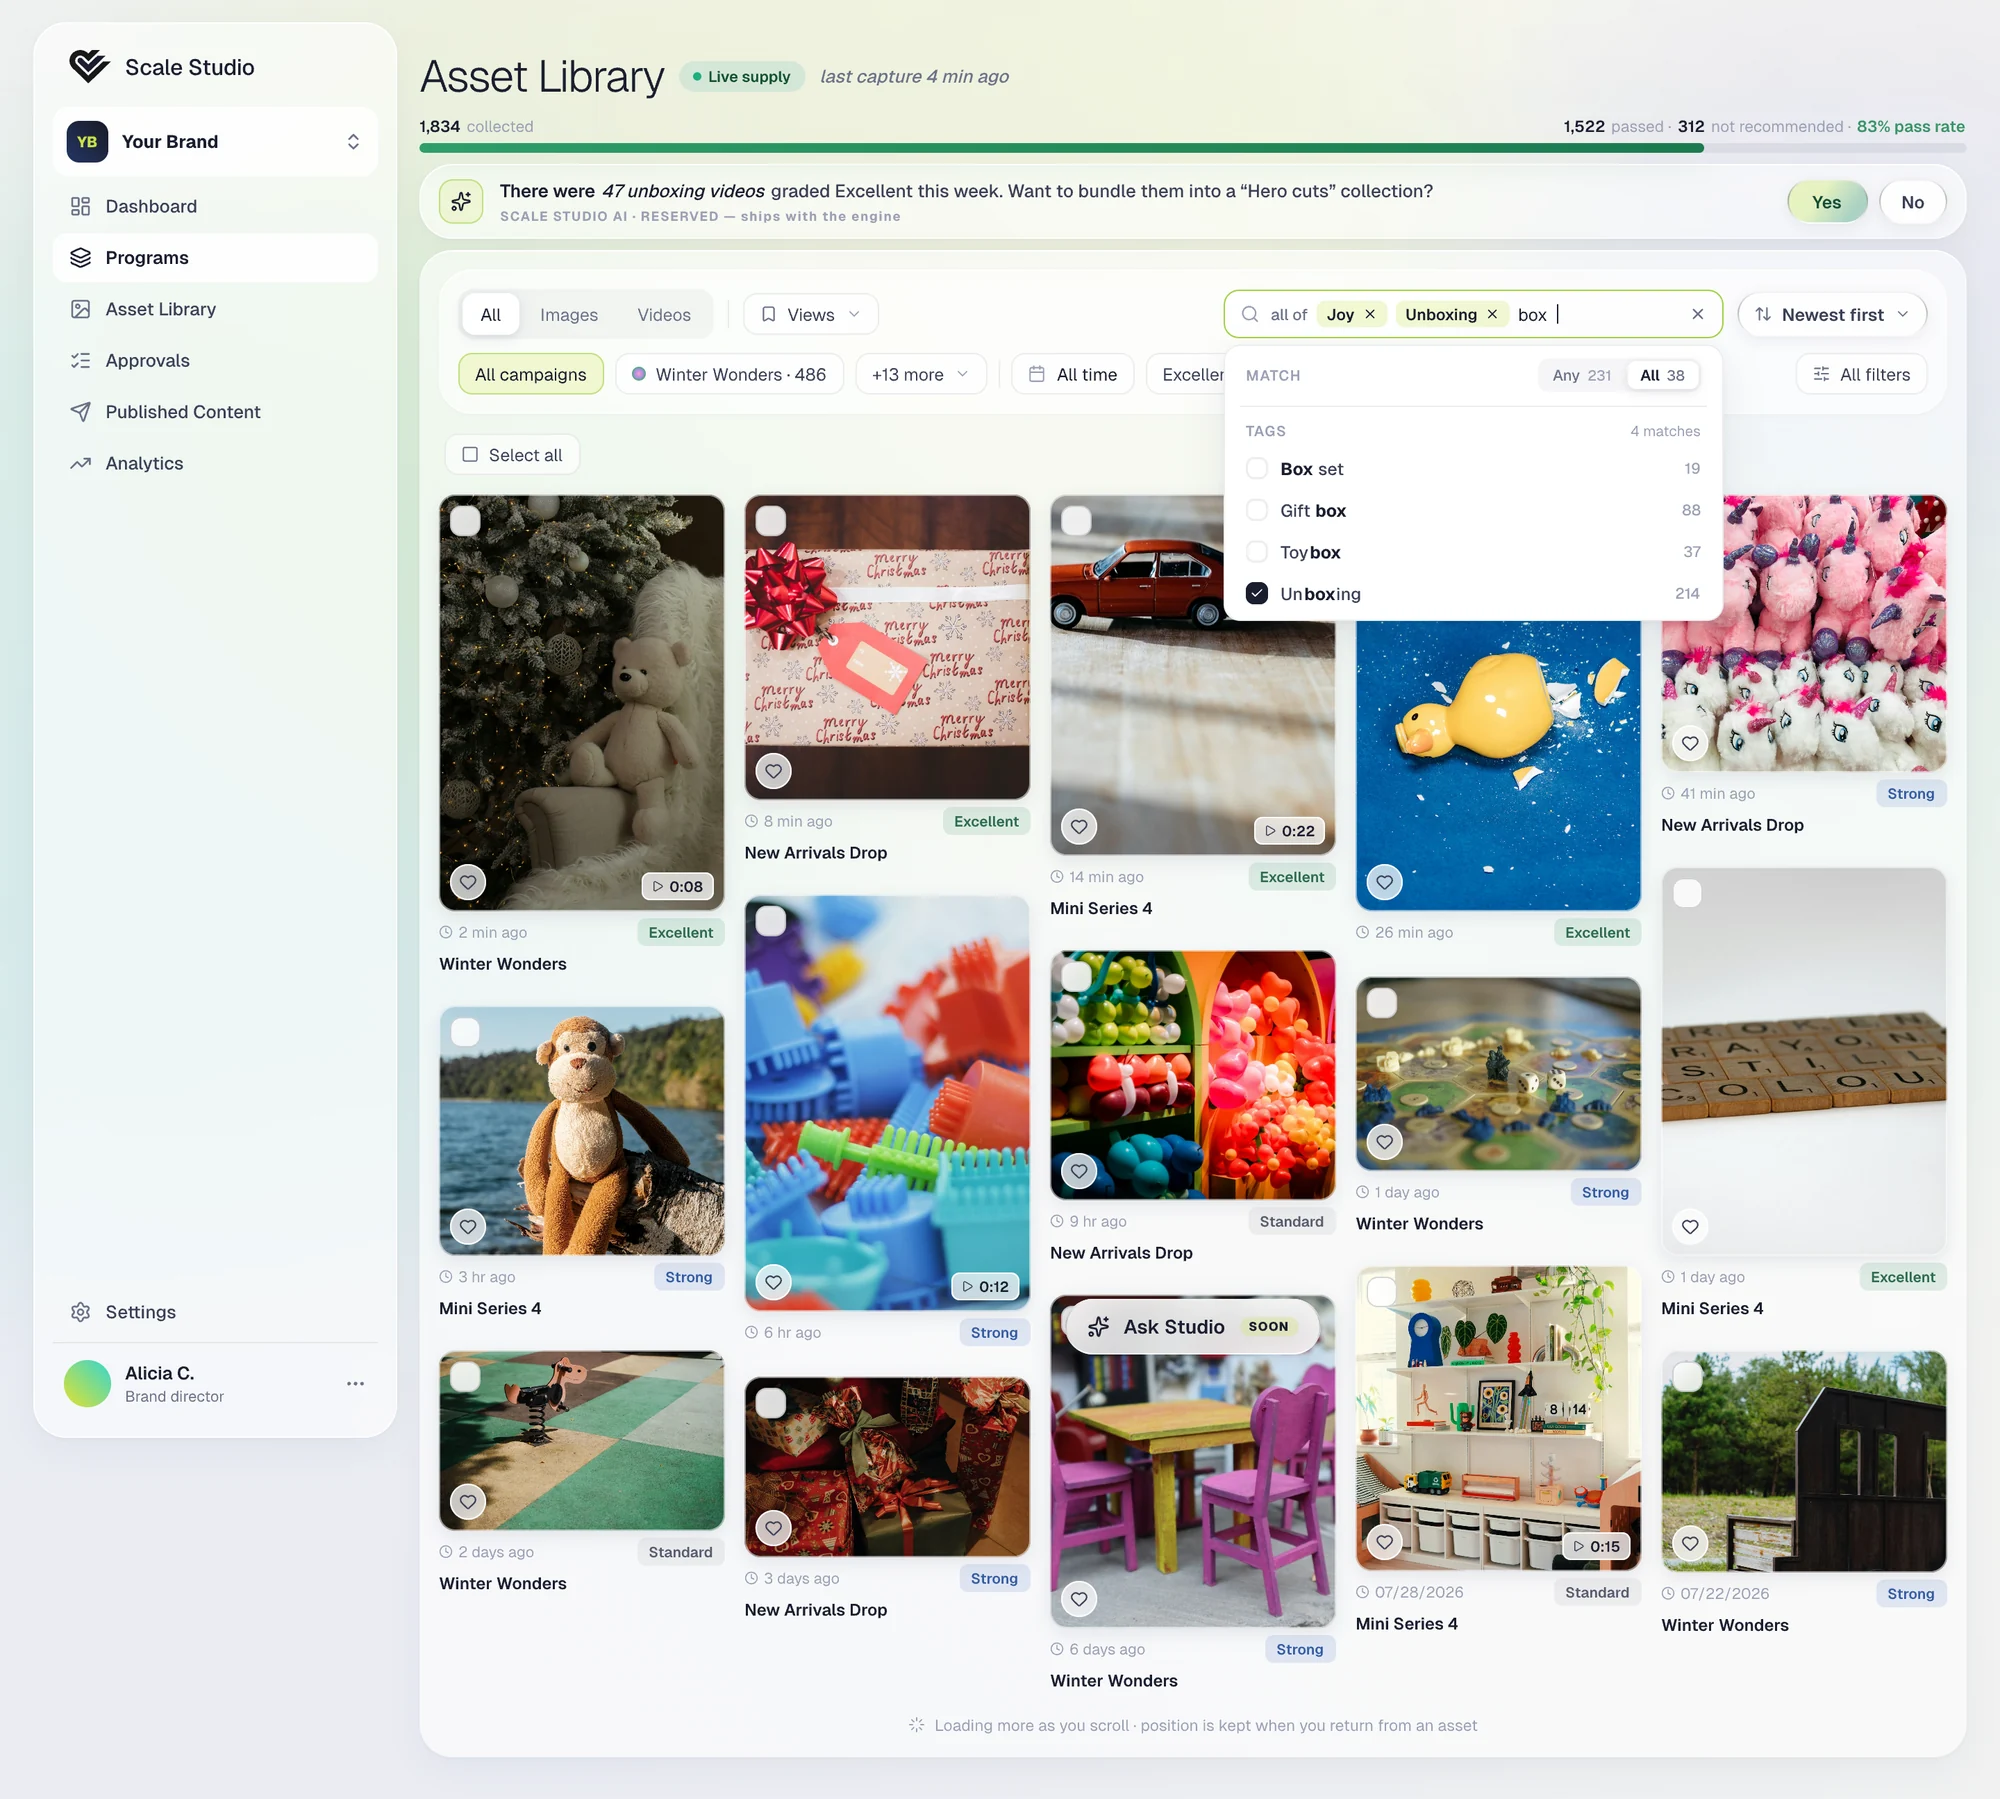
A usability session exposed whole-word-only matching. Restoring a separate Tags filter would add another control without fixing the search behavior.
I specified case-insensitive contains matching, with suggestions from two characters, across searchable lists. “box” can find Box set, Gift box, Toybox, and Unboxing.
02 / Aurora & engineering handoff
I translated Aurora’s visual direction into shared tokens and component rules. The intent was to make consistency part of the build, rather than something to repair screen by screen.
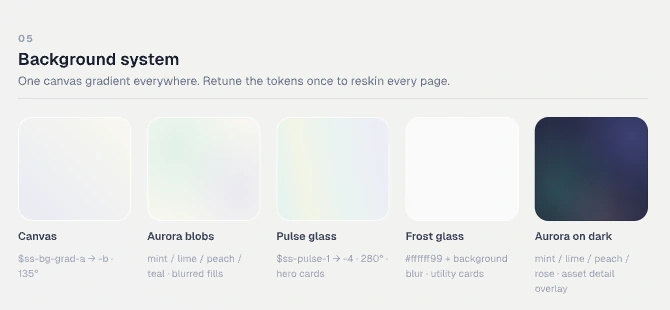
A token-bound base gradient with aurora layers. The foundation stays consistent while the composition can vary.
Pulse glass for hero and insight surfaces. Frost glass for utility cards and dense work areas.
Shared geometry, semantic variants, and defined focus states carry the interaction across screens.
Selected system details
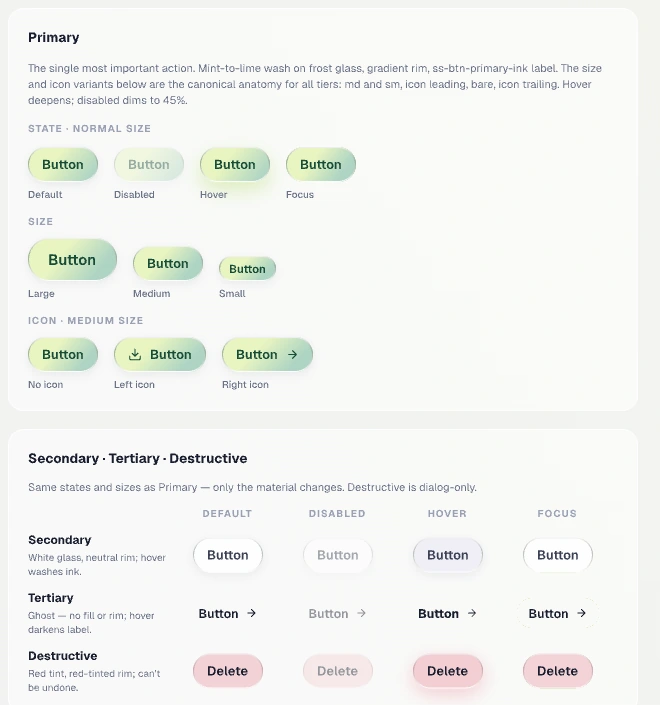
I used Pencil MCP and Claude Code to carry the design into draft pull requests, then reviewed the previews before engineering merged them. Product decisions, scope, and final review stayed with people.
Refine the design file, states, tokens, and scope.
Use Claude Code with explicit context and a bounded task.
Check visual fidelity, interactions, and the proposed changes.
Human review controls the merge. AI does not deploy.
Workflow guardrails: fetch the shared source before editing, keep changes small, inspect the preview, and require a human merge. AI does not deploy.
03 / Analytics that explain quality
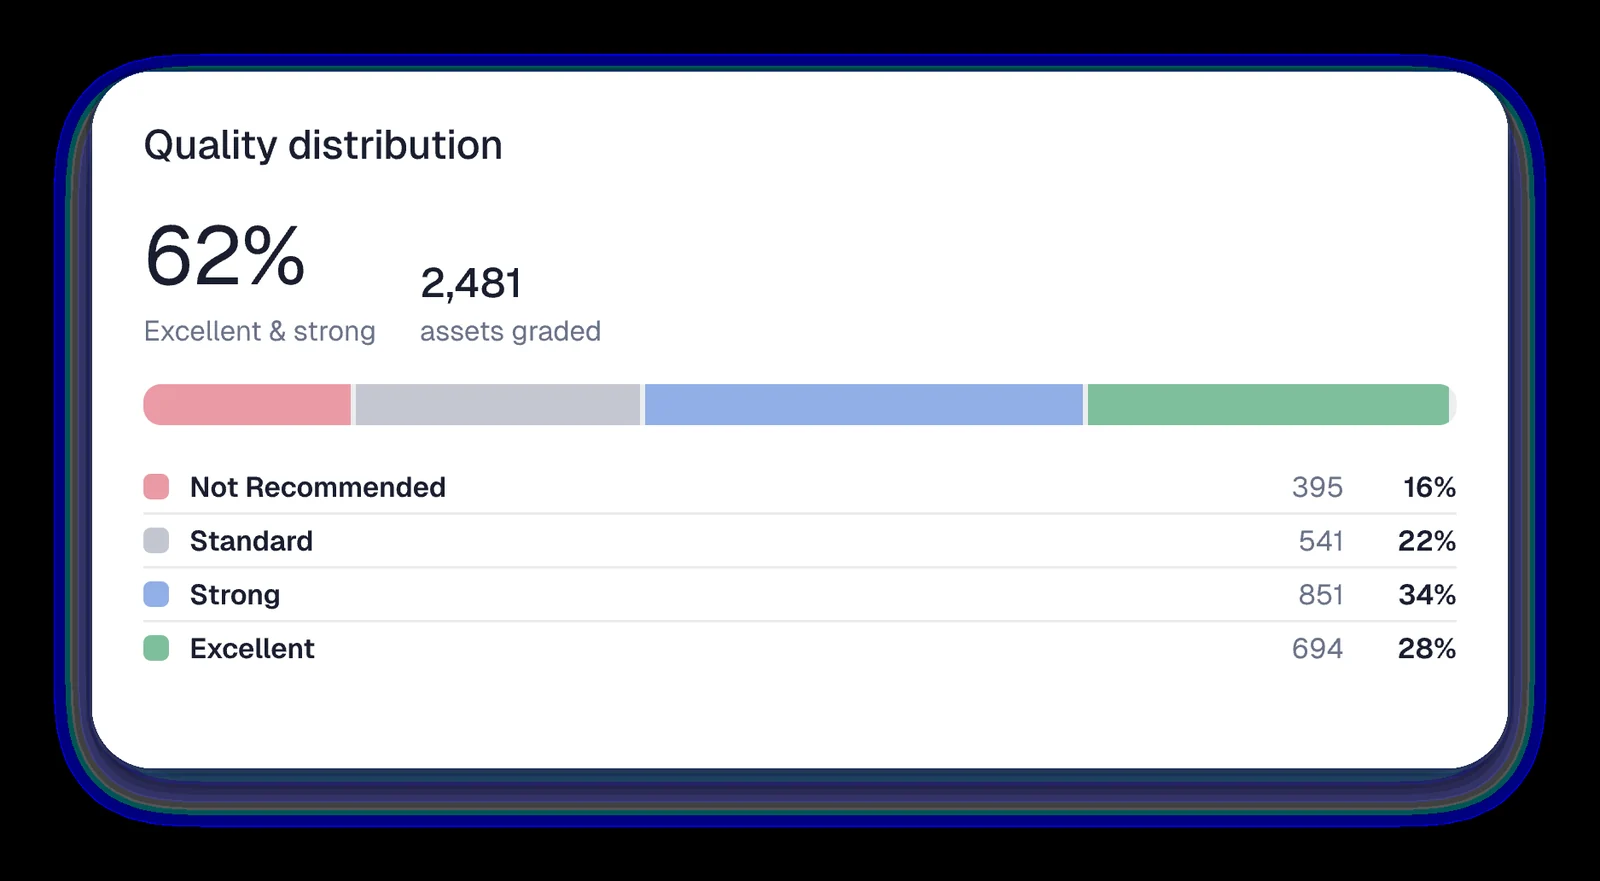
A chart should make the relationship between values clear. I redesigned the quality distribution to show what each category contributes to the whole.
Individually normalized columns made a partial share look full-height. I chose a single 100% segmented bar with a legend, so all categories use the same denominator.
The decision became a reusable component in Aurora, making the same visual logic available across the product.
A grocery client’s capture flow was rejecting roughly 90% of submissions. The setup was incomplete, and the rubric assumed restaurant-style content. Rather than lower the bar or retrain users, I wrote grocery-appropriate guidance: busy shelves and national brands can be valid content.
I also identified that scoring ignored the moment tag sent by the app and filed an engineering issue. After the configuration change, a dinner photo passed under Delivery—one observed result, not a measured improvement in the overall pass rate.
Reconstructed from working notes; no evaluation screen is shown.
Delivery / July–October 2026
The work progressed from a shared visual foundation to engineering specifications, draft implementations, and a Dashboard release to dev. These are delivery milestones; business impact has not yet been measured here.
Token system and two-tier glass shipped in the design files.
Capture App, Asset Library, and Campaigns & Brand specs handed to engineering.
A creator capture app moved from design to a Claude Code draft pull request.
Three pull requests from the design file, previewed and reviewed before engineering merged them.
Branded product demos supporting sales conversations.
What I take forward
I cut invented auth screens from a visual refresh and narrowed a capture-tips fix to two changes inside the existing card. Across the work, the same principle held: resolve the actual problem, encode the decision, then use AI to move faster.
Next to validate: whether teams can distinguish collected content from usable assets, find relevant tags, and interpret goal progress without assistance.